
Tankless vs Tank RO Systems: Flow Rate, Footprint and Cost Compared
Quick answer: A tank RO system makes water slowly, stores it in a pressurised bladder tank and pushes it out on demand. A tankless (direct-flow) RO system uses a much larger membrane and a pump to make water the moment the tap opens, with no storage between them. The three differences buyers care about resolve like this:
- Flow. Tank systems deliver a strong first glass and then fade as the tank empties, because the 50–100 GPD membrane behind them only produces 0.13–0.26 L/min. Tankless units rated 400–1,200 GPD deliver roughly 1.0–3.2 L/min continuously, so the delivered rate is the production rate.
- Footprint. Removing the storage tank typically frees 50–70% of the installation volume, which changes what is installable in a small cabinet, a tea point or a break-room counter.
- Cost. The tank platform wins on unit price; the tankless platform usually wins on five-year ownership cost, because it removes the tank as a service point and cuts drain losses.
The deciding variable is rarely the sticker price. It is the duty cycle: how many litres must be available in the busiest ten minutes of the day. Once that number is known, the format choice is almost mechanical.
How this article differs from a household buying guide: it is written for importers, distributors, private-label brands and commercial specifiers. Instead of “which should I buy for my kitchen”, it answers how to size, specify and cost a platform you will order repeatedly and support in the field. If you are new to the technology, start with how a reverse osmosis hot and cold dispenser system works; if you are choosing a supply partner rather than a format, read the OEM/ODM water purifier and dispenser manufacturing guide.
What is the actual difference between a tank and a tankless RO system?
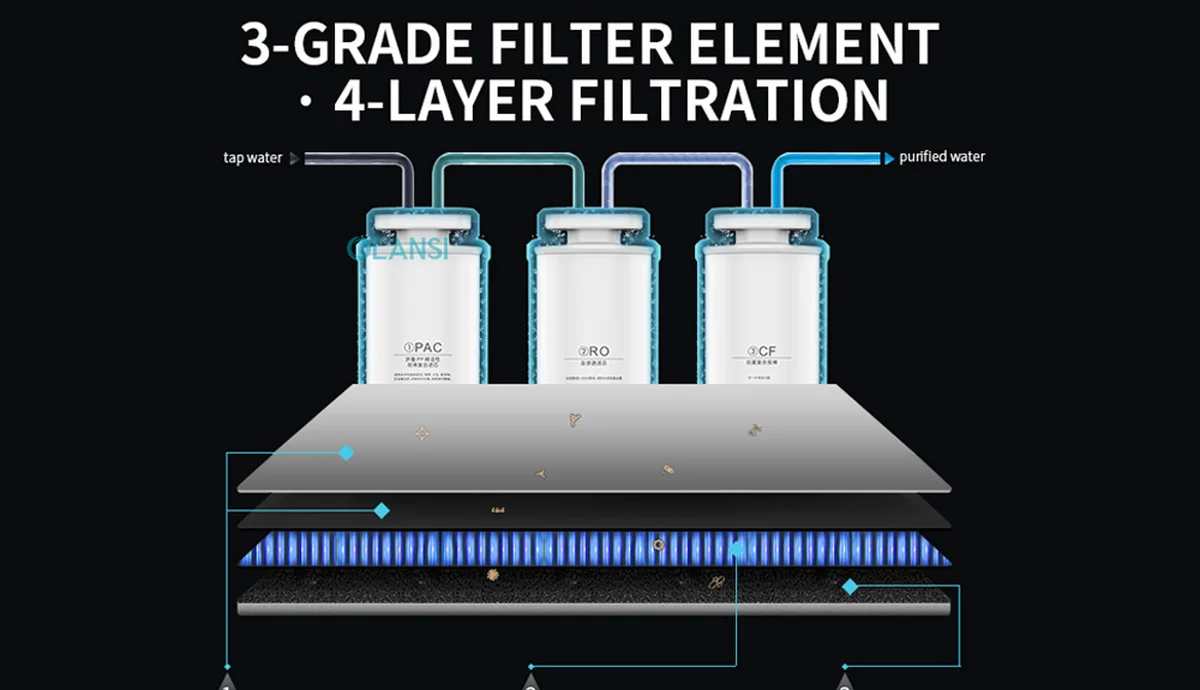
The two designs share an identical filtration train and differ only in buffering. In a tank RO system, a small membrane produces permeate slowly into a pressurised bladder tank, typically around 12 litres (3.2 gallons) nominal but with roughly 8–11 litres of usable draw before delivered pressure visibly drops. Opening the tap pushes stored water out with line/air pressure; the membrane quietly refills the tank in the background.
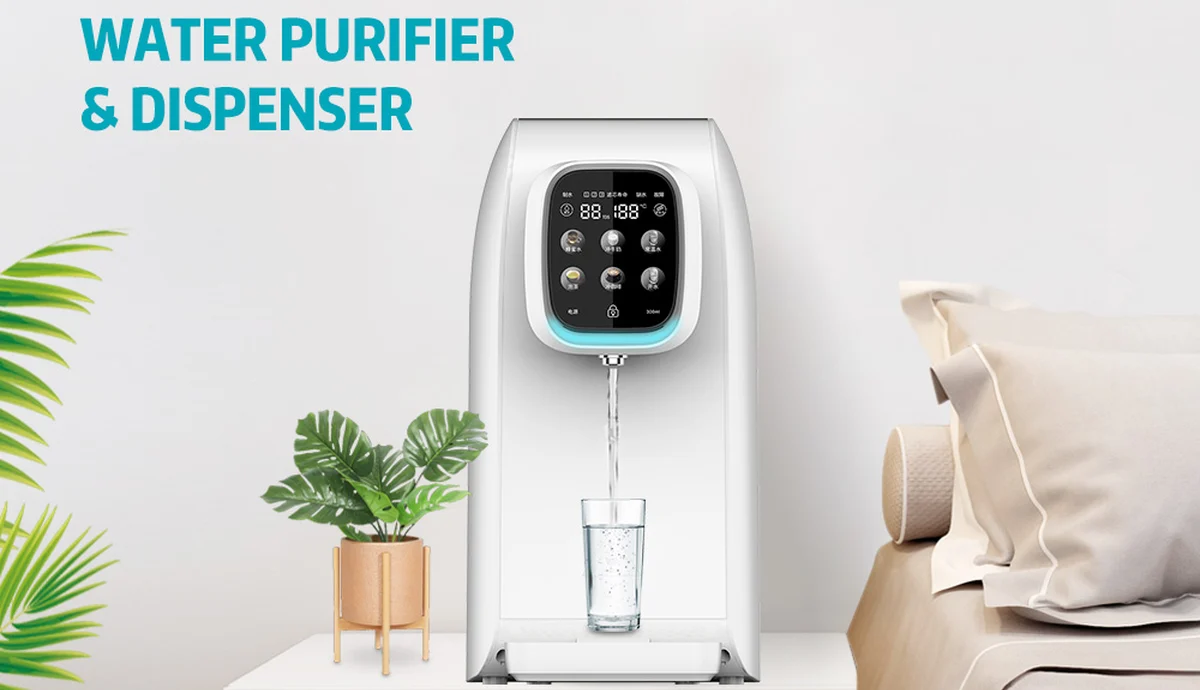
In a tankless RO system, also called direct-flow, there is no buffer at all. A high-output membrane plus an internal booster pump produces water at the instant of demand. The distinction matters because it relocates the bottleneck: a tank system’s limit is stored volume, while a tankless system’s limit is instantaneous membrane capacity. Everything else buyers complain about — fading pressure, stale taste, waiting for recovery — follows directly from which of those two limits applies.
Why did RO systems ever need a storage tank?
The tank was never a feature; it was a workaround for membrane capacity. Residential RO membranes historically produced 50–75 GPD, which is 0.13–0.20 L/min — far below the 2–4 L/min a drinking tap delivers. Without a buffer, a user could not fill a glass. With a 12-litre tank filled overnight, the same slow membrane becomes usable, because demand is pooled across the day.
That workaround stopped being necessary once high-flux membranes and compact booster pumps became affordable. At 600–1,200 GPD, production reaches 1.6–3.2 L/min, which is within the range of an ordinary drinking tap. Once production matches draw rate, storage adds cost, volume and hygiene risk while delivering no benefit. This is why the market shifted rather than why one design is inherently “better”: the tank solved a problem that no longer exists in most applications.
How does flow rate really differ: production rate versus delivered rate?
GPD measures production capacity, not what the user experiences. Confusing the two is the single most common specification error in this category, and it produces systems that look adequate on a datasheet and disappoint in service.
A 75 GPD tank system can honestly claim 75 gallons per day, yet deliver less than 0.2 L/min sustained at the tap — fine for filling one glass, unusable for filling a 2-litre kettle or serving a queue. A 1,000 GPD tankless unit produces 2.6 L/min and delivers substantially that figure continuously, because there is no intermediate reservoir to drain. The practical comparison is therefore between delivered litres per minute and peak simultaneous demand, not between GPD figures.
How do you convert GPD into a number you can design with?
Use the direct conversion: 1 gallon = 3.785 litres, one day = 1,440 minutes, so 1 GPD ≈ 0.00263 L/min. Multiplying by that factor converts any datasheet into a usable design rate, and it also reveals that most published comparisons are not comparing like with like.
| Membrane rating | Approximate production rate | What it realistically serves |
|---|---|---|
| 50 GPD | 0.13 L/min | Small household with tank buffering; slow recovery |
| 75 GPD | 0.20 L/min | Standard tank system; one or two-person use |
| 100 GPD | 0.26 L/min | Upper end of traditional tank designs |
| 400 GPD | 1.05 L/min | Compact tankless; apartment or single-point office use |
| 600 GPD | 1.58 L/min | Family kitchen or small office tea point |
| 800 GPD | 2.10 L/min | Busy household or ~20-person workplace |
| 1,000 GPD | 2.63 L/min | Small café, clinic, staff kitchen with continuous draw |
| 1,200 GPD | 3.15 L/min | High duty cycle, multi-outlet or light HoReCa service |
Two corrections should be applied when using the table. First, manufacturers quote production at a stated feed temperature and pressure; cold feed water and low inlet pressure both reduce real output, sometimes by 20–30%. Second, no RO unit runs at its maximum continuously — treat the figures as a peak sustained rate, not a guaranteed floor.
How do you size an RO system for peak demand rather than daily volume?
Daily volume almost never governs the decision; coincidence does. A workplace may consume only 40 litres across a day, but if 25 of those litres are drawn between 10:00 and 10:15, the required peak rate is 1.7 L/min and the daily figure is irrelevant. Sizing therefore starts from the busiest window, not the week.
The practical method has four steps. Estimate simultaneous users during the peak window; multiply by typical draw per use (a glass ≈ 0.25 L, a kitchen kettle ≈ 1.5–2 L, a bottle refill ≈ 0.5–0.75 L); divide by an acceptable wait window in minutes; then compare the result against the production rate table with a 20–30% margin for cold feed and ageing filters.
A 30-person office illustrates the point. Assuming six simultaneous draws of 0.5 L within a five-minute window, peak demand is 0.6 L/min — comfortably served by a 400 GPD tankless unit and also by a tank system, provided the tank is full. Add a commercial coffee machine drawing 1.5 L/min intermittently and the tank option fails, because the tank empties in about six minutes and then falls to the membrane’s 0.2 L/min while the queue waits. The tankless unit simply produces at rate. This is why the duty cycle, not headcount, decides the format.
Which efficiency claims can you trust?
Efficiency is where published comparisons contradict each other most, because the industry uses the same colon notation for two inverse meanings. Some datasheets quote a waste ratio (drain : permeate), others quote a pure-to-drain ratio (permeate : drain), and both are written as “1:3”. One of those means 25% recovery and the other means 75% recovery — a threefold error hidden in a symbol.
Ask instead for recovery rate, defined unambiguously as permeate ÷ feed water. Traditional tank systems typically recover 20–30%, meaning three to four litres go to drain for every litre produced. Modern tankless systems commonly recover 50–67%, and well-designed units reach higher. Expressing everything in recovery eliminates the notation trap and makes quotes directly comparable.
The reason this is worth quantifying is cost, not virtue. At a consumption of 10 litres per day, moving from 25% to 60% recovery changes drain volume from roughly 30 litres to 6.7 litres daily — about 8,500 litres per year. In metered or water-stressed markets that is a real operating line, and versions of this argument increasingly appear in municipal efficiency requirements.
How much cabinet space does each design actually need?
Footprint should be quoted as an installation envelope, not a base area, because height and service access are what actually block installations. A complete tank setup combines a filter manifold and a pressurised bladder tank that is typically 25–30 cm in diameter and 35–45 cm tall standing beside it; the assembly commonly occupies roughly 1.5–2.2 cubic feet and requires vertical clearance that garbage disposals, waste bins and cleaning supplies routinely compete for.
A tankless unit consolidates everything into one chassis, often 12–20 cm wide and 40–45 cm tall, mounted flat against the cabinet wall. Typical published comparisons put the reduction at 50–70% of occupied volume, and the operational difference is frequently binary: either the unit fits beside the existing cabinet contents, or it does not.
Access for filter changes is part of the same envelope accounting. A horizontally mounted tankless unit can leave its front-facing cartridges reachable without moving stored items, whereas a tank arrangement often requires clearing the cupboard to reach side-mounted housings. Specification should therefore state the clear envelope required for service, not just for installation.
Why does footprint matter more to a commercial buyer than to a homeowner?
Because in commercial premises space is priced. Every square metre of back-of-house area carries rent, and a countertop running along a staff kitchen has a finite linear budget. A machine that frees 60% of cabinet volume can be the difference between installing purified water at all and sending staff to buy bottled water.
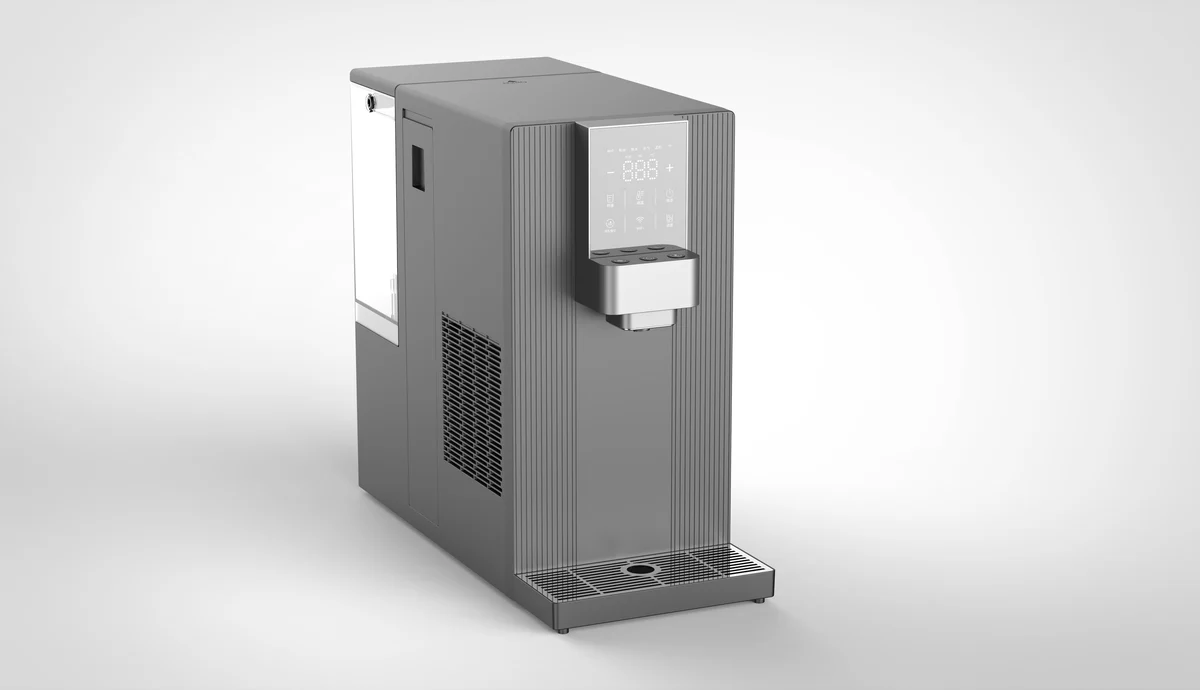
Footprint also determines which product formats are sellable in a given market. Compact tankless platforms enable categories that tank designs physically cannot occupy — slim under-sink units, countertop instant-heat dispensers, and combination hot-and-cold units where heating and cooling hardware already consumes most of the chassis. This is explored further in the article on countertop hot and cold water dispensers for home and office, where internal volume is competed for by tanks, compressors and heating elements simultaneously.
For a distributor this becomes SKU strategy: one compact platform can be placed in several use contexts with different housings, whereas a tank platform generally has a single installation shape. The same packaging constraints are among the largest cost drivers discussed in what determines the cost of a countertop RO dispenser.
What does each design cost to buy?
Purchase price still favours the tank platform, though the gap is narrower than it was. Traditional 50–100 GPD tank systems are mature, highly standardised products with minimal electronics, and they remain the lowest-cost way to deliver RO-quality water. Tankless units add a booster pump, control board, larger membrane housing and usually a TDS sensor, all of which raise bill-of-materials.
That gap has narrowed as high-flux membranes commoditised while tank-system pricing barely moved. For a private-label brand, the direction of travel matters more than the current delta: specifying a tank platform risks entering a category whose replacement cycle is already shifting. Component-level costing belongs in the platform discussion with your manufacturer, which is why the guide to choosing an OEM/ODM water purifier manufacturer treats tooling and platform selection as one decision.
What does each design cost to own over five years?
Purchase price is typically the smaller half of the total for both formats. The larger half consists of consumables, service visits, drain losses, electricity and warranty claims, and the two designs distribute those costs very differently.
| Cost element (illustrative, 5 years) | Tank RO | Tankless RO | Why they differ |
|---|---|---|---|
| Pre/post filters (6–12 month interval) | Lower per cartridge | Higher per integrated cartridge | Tankless uses composite cartridges that bundle media |
| RO membrane (2–3 year interval) | Lower | Higher | Larger membrane area costs more to replace |
| Tank replacement or bladder service | Yes — periodic | None | Bladders lose air charge and eventually soak through |
| Sanitisation callouts | Occasional | Not required | Stored water can develop biofilm; no storage means no need |
| Drain water charge | Higher | Lower | Recovery typically 20–30% versus 50–67% |
| Electricity | None to minimal | Small continuous draw | Pump and controls need standby power |
| Installation labour | Lower | Higher where no socket exists | An outlet under the sink may need adding |
| Warranty claim rate | Higher | Lower | Tank-related faults are a leading service cost |
The figures above are illustrative structure, not a quotation; substitute your own local tariffs and labour rates before committing to a range. What survives any reasonable substitution is the direction: the tank platform is cheaper to acquire and more expensive to keep, while the tankless platform inverts that relationship. At low duty cycles with cheap water, the tank platform can still come out ahead over five years; at high duty cycles, expensive water or metered drain charges, tankless normally does.
Where do the hidden service costs come from?
Three sources account for most after-sales cost differences, and none appear in the unit price. The first is the tank itself: bladder tanks lose their pre-charge air over time and eventually waterlog, producing the familiar complaint that “it fills my glass but stops halfway”. It is a service call that requires parts and labour, and it recurs.
The second is joint count. Traditional assemblies use several discrete housings linked by push-fit tubing, so each joint is a potential leak and each filter change disturbs several; integrated manifolds and quick-change cartridges cut that count substantially. That reliability argument is developed further in the article on the advantages of under-sink RO configurations.
The third is user-facing maintenance behaviour. A system that requires the user to remember a schedule generates misset intervals, whereas one that displays filter life and flushes itself generates fewer neglected units and fewer warranty disputes. For anyone reselling, “How many truck rolls per 100 installed units per year?” is a more useful vendor question than any performance claim, and a structured maintenance programme for RO hot and cold dispensers reduces it further.
Do the two designs differ in water quality and hygiene?
Contaminant rejection depends on the membrane and its certification, not on whether a tank exists. Both formats, when built with equivalent membranes, remove dissolved solids, hardness, nitrates and the great majority of heavy metals and PFAS compounds to comparable specifications. Any claim that one design “filters better” for reasons of architecture alone should be treated with suspicion.
Three secondary quality effects are nonetheless real. Stagnation: stored water can develop biofilm on the bladder over months, which is why traditional tank manufacturers recommend periodic sanitisation, and absence of storage removes the mechanism. TDS creep: the first draw from a tank that has been idle often reads higher than steady-state, because ions diffuse across the membrane during standstill — a well-known tank phenomenon that disappears in direct-flow units. Taste: users reliably prefer freshly produced water, and this is the difference they actually report, even though laboratory parameters may be similar.
Those effects carry more weight in commercial settings than domestic ones, because a machine may sit unused over a weekend and then serve hundreds of draws on Monday morning. See the background on the benefits of reverse osmosis treated water for what purification does and does not change.
Which certifications change when you move from tank to tankless?
Changing architecture changes the certification perimeter, and this often surprises importers late in the process. A standard tank system is largely a passive plumbing article: performance certification for the membrane substantially carries the product. Introducing a pumped, electronically controlled unit brings additional obligations.
- Membrane and system performance: both formats should carry performance certification to the applicable RO system standard, most commonly NSF/ANSI 58 for total dissolved solids reduction, verified against the actual configuration sold.
- Lead-free and material safety: wetted components are normally assessed for lead content and extractables, since the water contact path is what regulators test.
- Electrical safety: a tankless unit’s pump, control board and any display put the product into scope for electrical appliance safety rules in most markets, including CE marking for the European Economic Area and UKCA marking for Great Britain.
- Pressure containment: a bladder storage tank is a pressurised vessel, and several jurisdictions treat pressurised vessels within a distinct regulatory class; removing the tank can simplify that aspect.
- Product material rules: RoHS, REACH and, depending on the market, food-contact material declarations apply to electronic and polymeric parts that become more numerous in a tankless unit.
The practical instruction is to confirm which approvals the target market requires before selecting a platform, because adding electrical compliance after tooling has begun is expensive. Articles such as the RO filtration market review for the Philippines show how requirements diverge between destinations.
Which design should you choose for each buying scenario?
The answer changes with application, and the honest framing is “which constraints bind”, rather than which technology wins. The matrix below maps common procurement situations to the usually stronger choice, along with the constraint that drives it.
| Scenario | Usually stronger | Binding constraint |
|---|---|---|
| Price-driven tender, offtake not yet proven | Tank RO | Lowest unit cost, minimal compliance surface |
| No reliable power at the point of use | Tank RO | Tank dispenses on stored pressure without electricity |
| Very low duty cycle, one or two users | Either | Tank downtime never becomes visible |
| Limited cabinet or counter depth | Tankless | No pressurised vessel occupies 50–70% less volume |
| Office, clinic or café with peak queues | Tankless | Delivered rate equals production; no recovery wait |
| Metered or water-stressed supply | Tankless | Higher recovery cuts drain volume materially |
| Countertop, desk or combination dispenser | Tankless | Chassis volume is contested by heating and cooling hardware |
| Premium positioning with monitored performance | Tankless | TDS display, filter-life indication and auto-flush are expected |
| Continuous process water above ~1,500 GPD | Neither | A different commercial equipment class is required |
Two rows deserve emphasis because they are commonly mishandled. “Very low duty cycle” genuinely is a tie, and choosing tankless there only pays where water costs or hygiene optics justify it. Conversely, “no reliable power” is a hard veto rather than a preference: an unpumped tank unit dispenses in a power cut and a tankless unit does not, and no amount of upstream advantage overrides that.
What should OEM and ODM brands specify when choosing a platform?
Brands building a private-label line face a different question from single-unit buyers, because they are choosing a recurring aftermarket as much as a product. Specify along five measurable axes:
- Output at stated conditions. Require delivered L/min at a defined feed pressure, feed temperature and TDS — not a bare GPD figure — and ask for the test report.
- Recovery at the same conditions. State recovery as permeate ÷ feed, since that removes the colon-notation ambiguity discussed earlier.
- Installation and service envelope. Give the clear height, width, depth and front clearance needed both to install and to change a filter.
- Consumable strategy. Define cartridge type, interval, price to the end user and availability horizon, because filter revenue is usually the durable part of the business.
- Certification plan by market. List each destination with its required approvals, and who pays for testing.
Then decide OEM versus ODM on that basis, using the framework in the OEM/ODM manufacturing guide. Where differentiation matters, an ODM route on a proven tankless platform usually beats developing either format from scratch. Suppliers shortlisted through resources such as how to find the best water purifier manufacturer in China can be compared on these five axes rather than on catalogue photographs.
What belongs in the specification before you send it out?
A single request-for-quotation page prevents most downstream disputes. Include these four items: peak duty cycle in litres per ten minutes; available installation envelope and whether mains power exists at that location; local feed water TDS, hardness and pressure; and destination markets with their required certifications. Those four inputs allow any competent manufacturer to recommend a configuration and quote it.
Also state what evidence you want back. Asking for delivered flow at stated feed conditions, recovery, membrane part number and its certification, filter intervals with prices, and warranty terms including what tank or pump failures do to the claim, converts a vague comparison into decisions you can defend internally.
Frequently asked questions
Is a tankless RO system always faster at the tap?
In delivered rate, yes in practical terms: 400–1,200 GPD produces 1.0–3.2 L/min continuously, whereas a tank system’s sustained rate is set by its 50–100 GPD membrane at 0.13–0.26 L/min once the stored reserve is drawn down. The tank can feel faster for the first litre or two while full.
Do I always need power under the sink for a tankless system?
Yes for the standard design. The booster pump and controls require mains power, which typically means an outlet within the cabinet; where none exists, adding one is an installation cost that must be budgeted rather than discovered.
How much drain water does each design use?
Tank systems commonly recover 20–30% of the feed; tankless systems commonly recover 50–67%. At 10 litres per day that is roughly 30 litres drained versus roughly 7 litres — about 8,500 litres difference annually.
Is tankless water safer or purer?
Rejection performance depends on membrane specification and certification and is comparable across formats. The genuine differences are secondary: no stagnation, no biofilm risk from a bladder, and no TDS creep on first draw after idling.
Which costs more over five years?
It depends on duty cycle and water tariff. The tank platform usually costs less to buy and more to keep, because of tank servicing, higher drain losses and more service calls; the tankless platform inverts that. Model both with your local figures rather than assuming either answer.
Can one platform serve several markets?
Usually yes at platform level, provided compliance differences are handled per destination. The common failure is treating certification as an afterthought after tooling, so confirm each market’s requirements during platform selection.
Source your tankless or tank RO platform with OLANSI
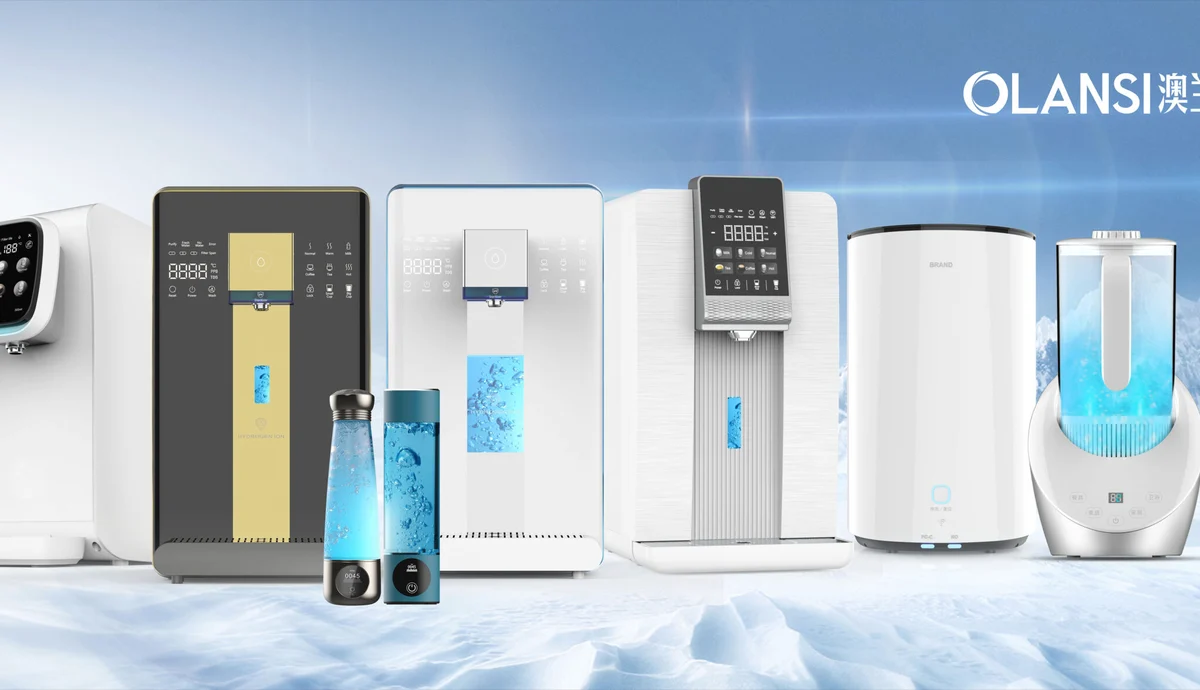
OLANSI Healthcare has manufactured water treatment and home health appliances in Guangzhou, China, since 2009. The company operates its own production base with in-house tooling, injection moulding, filter manufacturing, assembly lines and a water testing laboratory, supported by an established quality management system and an R&D centre that releases new platforms each year. An overview of the factory workshop, quality control and the R&D centre is available for review.
The product range covers both architectures in the formats the market asks for:
- under-sink and countertop water purifiers, including tankless and direct-flow configurations
- hot and cold water dispensers combining RO treatment with instant heating and cooling
- sparkling water dispensers for hospitality and office applications
- hydrogen water makers for wellness-focused ranges
Through the OEM/ODM service, OLANSI supports platform selection, industrial design, customisation, testing and certification planning, mass production and long-term replacement filter supply for each installation base.
Distributors, retailers, project contractors and brand owners can send their target markets, expected duty cycle, installation envelope, local water conditions, preferred format and annual volume. The engineering team will recommend a tank or tankless configuration, or a mix across the range, with platform options, certification guidance and a quotation. Contact OLANSI to request samples, a catalogue or a proposal, or browse the water purifier range for format comparisons.